Using Skylight to Solve Real-World Performance Problems [Part III: Code Triage]
This post is the last in an ongoing three-part series, and is a write-up of the talk we gave at RailsConf 2018. You can find the slides here, or read Part I and Part II of the series to catch up.
In Part II of the Skylight for Open Source Series, we explored how to spot problematic indexing using Skylight. In this installment, we'll dig into some hidden performance issues in another open source app: Code Triage.
An Introduction To Code Triage
Code Triage is an open source app built to help other open source projects. Popular open source projects receive a lot of bug reports, feature requests, and pull requests every day, and just reading through all of them can be a huge time sink for their maintainers. Here at Skylight, we are involved in a number of popular open source projects ourselves, so we understand this problem pretty well!
Code Triage lets you help out your favorite project maintainers by sending contributors a random ticket to their inboxes on a daily basis, which allow them to help triage GitHub issues and pull requests. That way, contributors can help split the workload, so everyone only has to do a little bit of work each day. Today, there are tens of thousands of developers who signed up to help thousands of open source projects on the site.
Running an app at this scale creates some pretty unique challenges. A quick glance at Code Triage's home page reveals some of the most popular projects and shows exactly how many open issues need to be triaged.
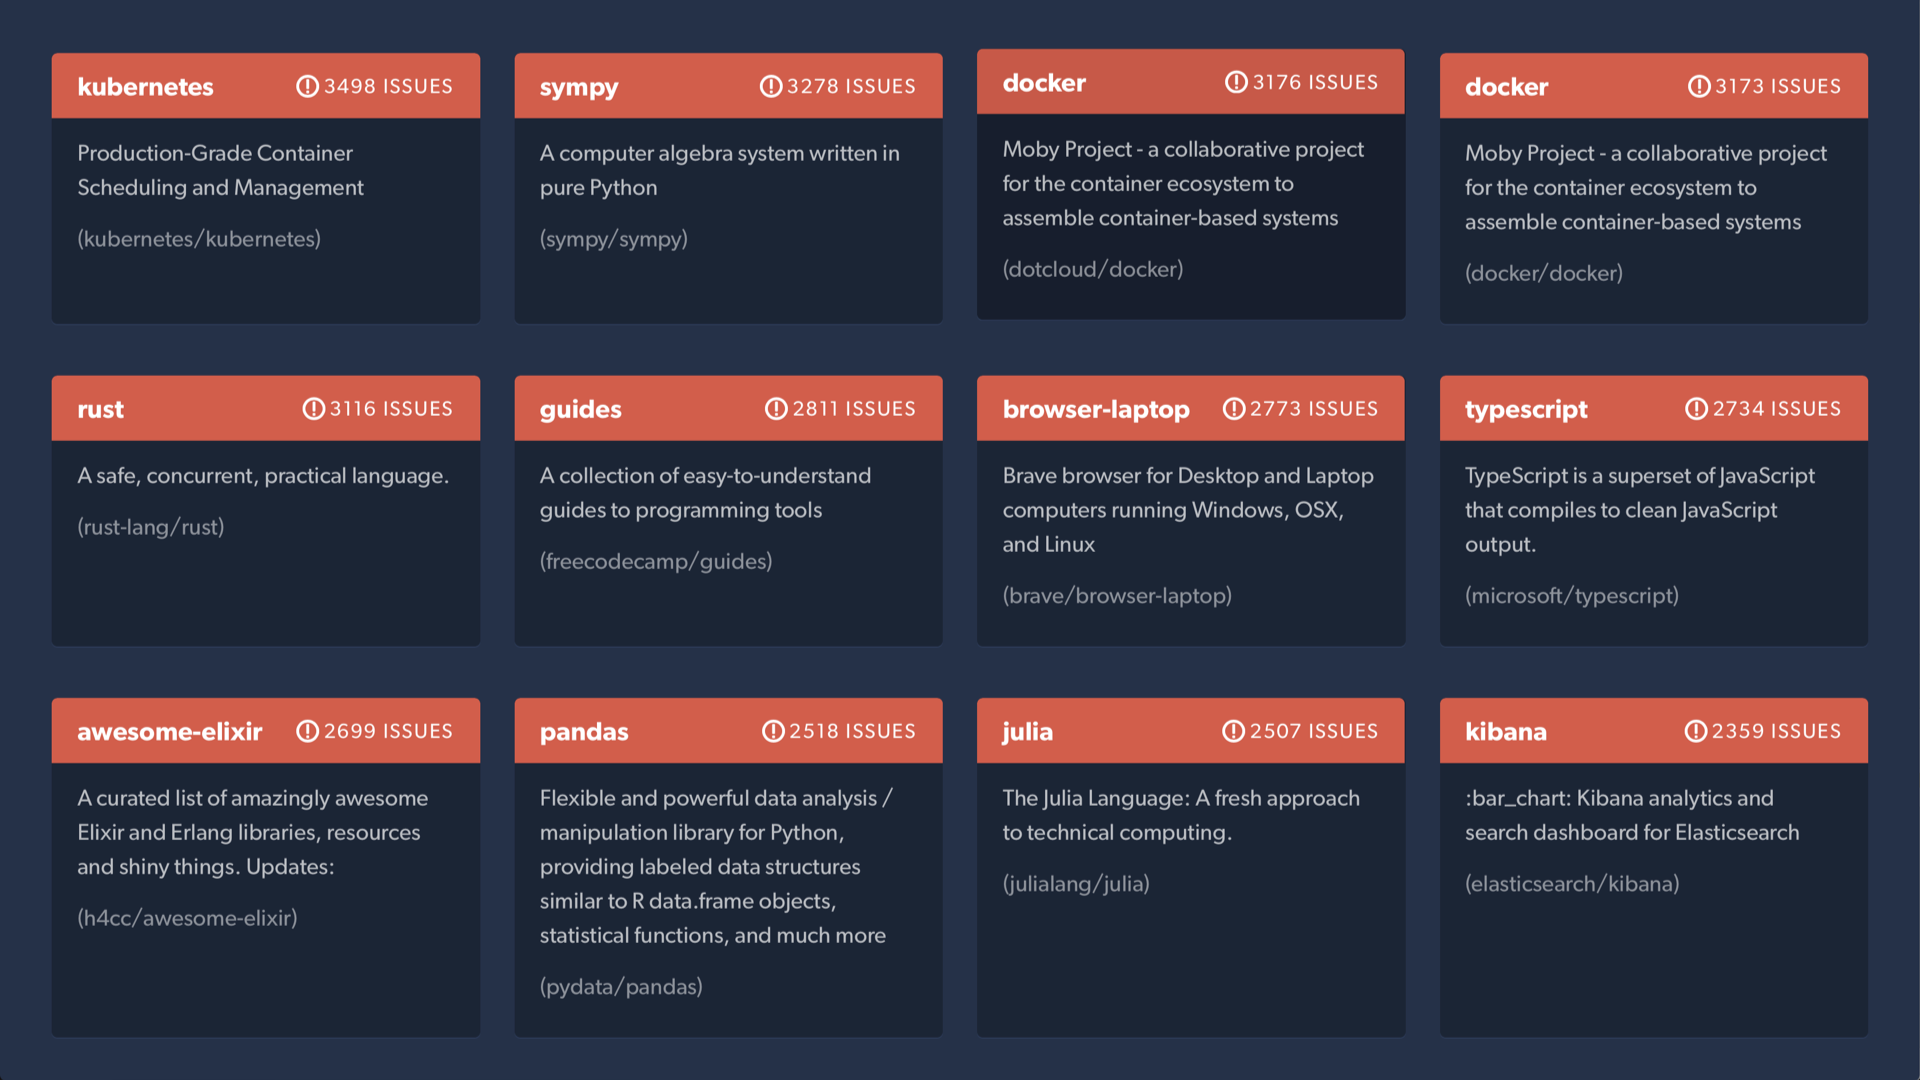
This can be a lot of information to render, and it can get a little slow at times. However, this is also by far one of the most popular pages in the app, since it's what everyone sees first when they visit the site.
Quick & Easy Caching
Skylight marks Code Triage's homepage as an endpoint with "high agony", which means that we'll probably get good bang for our buck if we choose to optimize it.
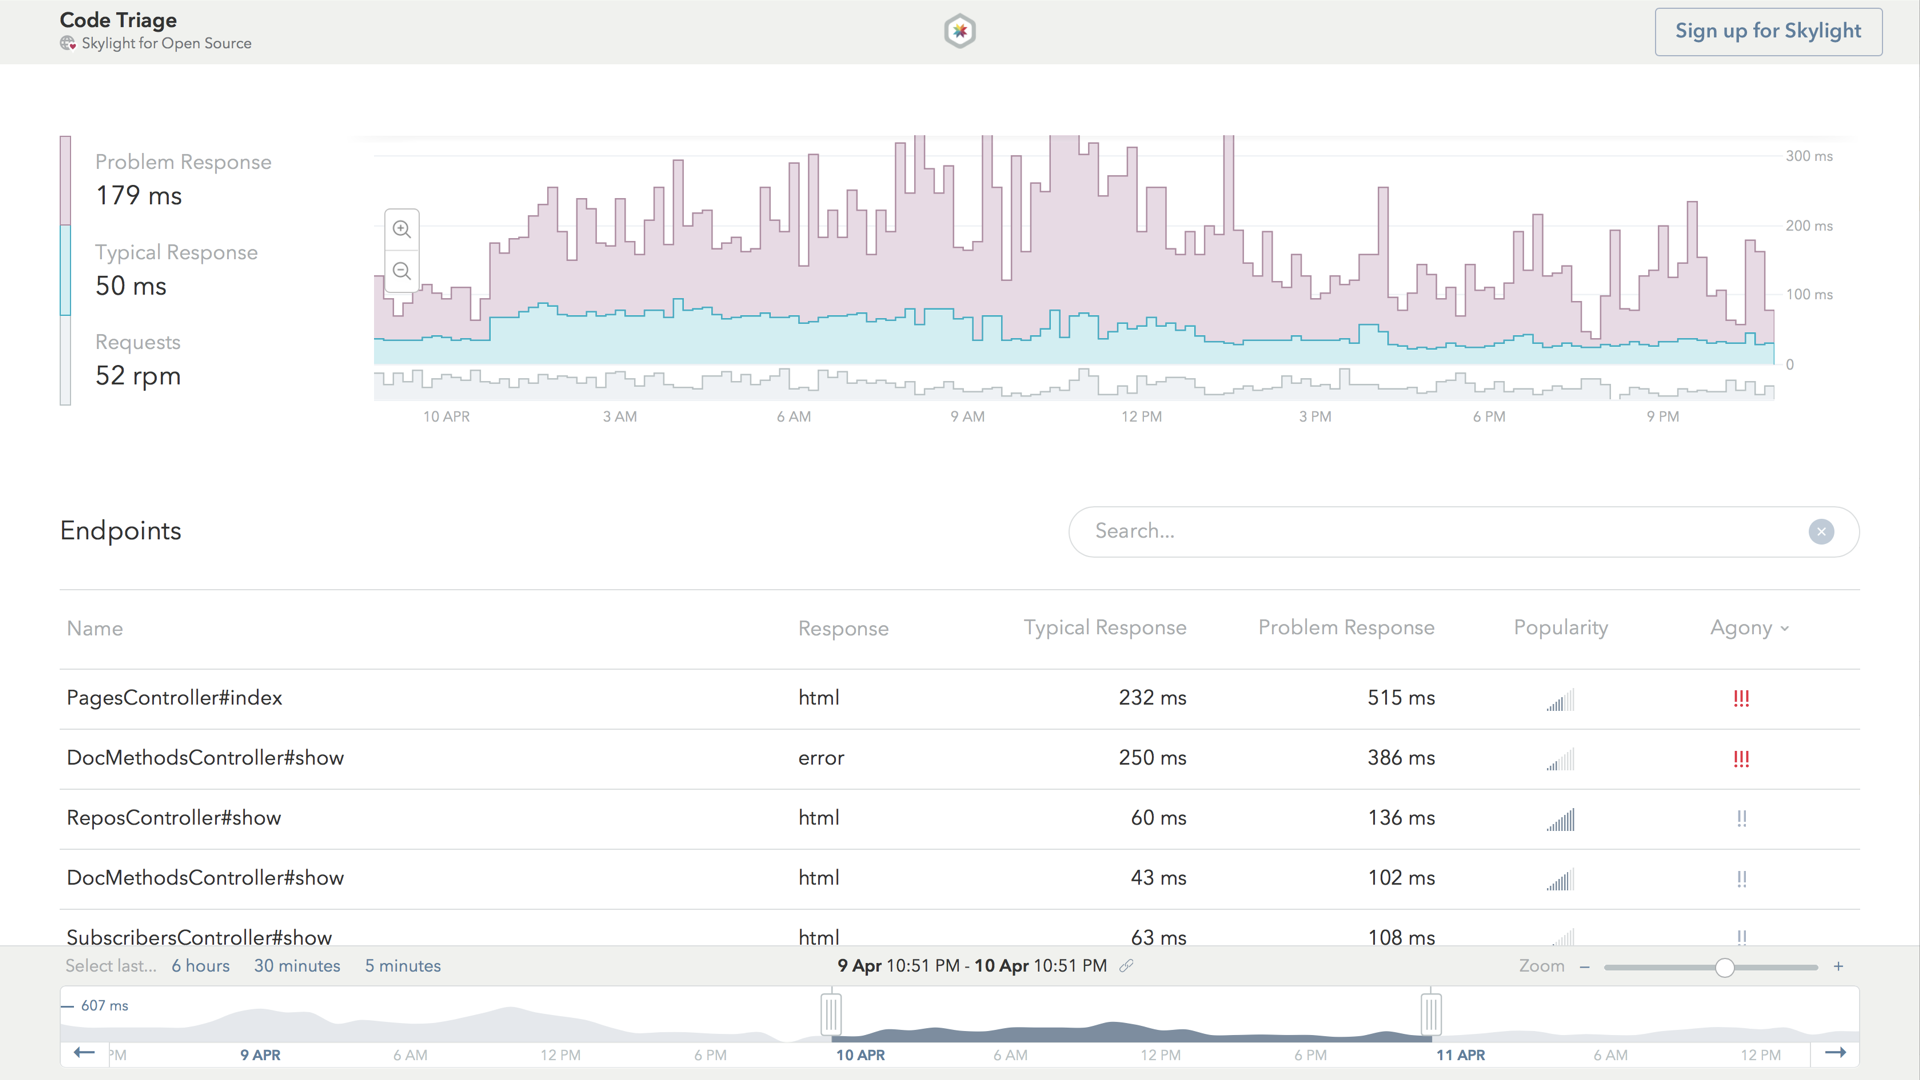
Notably, even though there's a lot of information on the home page, most of these things don’t actually change all that often, which makes this page a prime candidate for caching. But, as it turns out, a lot of performance-minded people have already done extensive work on Code Triage, so most things that should be cached actually already are!
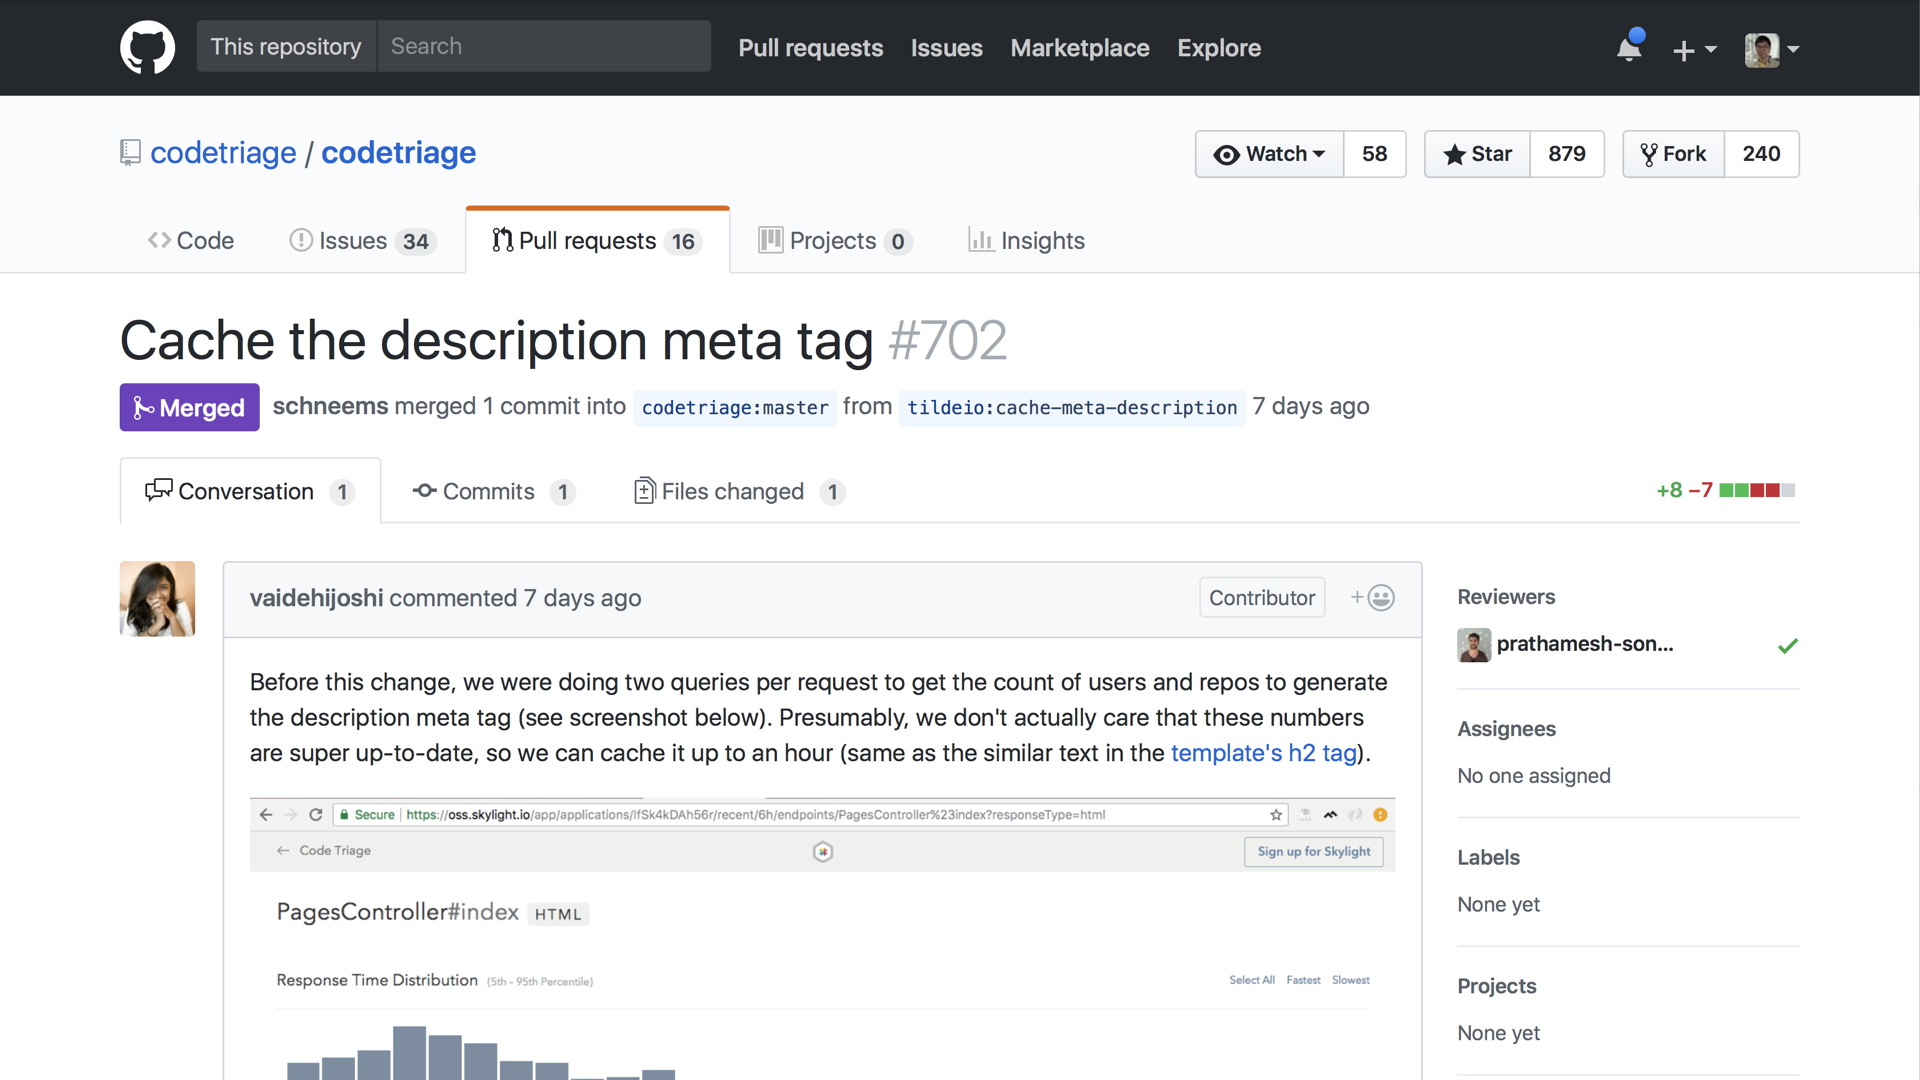
However, when we took a closer look at this page on Skylight, we noticed that, in order to populate the <meta> tag, we needed to run two queries to fetch the counts of users and projects on the site.
It's likely that these numbers didn't need to be super up-to-date, so we implemented some caching here. We submitted a pull request to cache this information for up to an hour.
After deploying this small change, we noticed that we had shaved off a little bit of time for the homepage, just as expected.
Confusing Cache Queries
Aside from the header and footer of Code Triage's homepage, most of the time spent in this request went into rendering the repository list cards.
Even the most popular project only seemed to have a new issue opened a handful of times in a day. This meant that these cards were also well-suited for caching, too. But, as we mentioned earlier, many obvious parts of this app had already been cached, including these cards. In fact, they were cached in a pretty smart way.
If you were to implement caching here using a naive solution, you would probably do something like this.
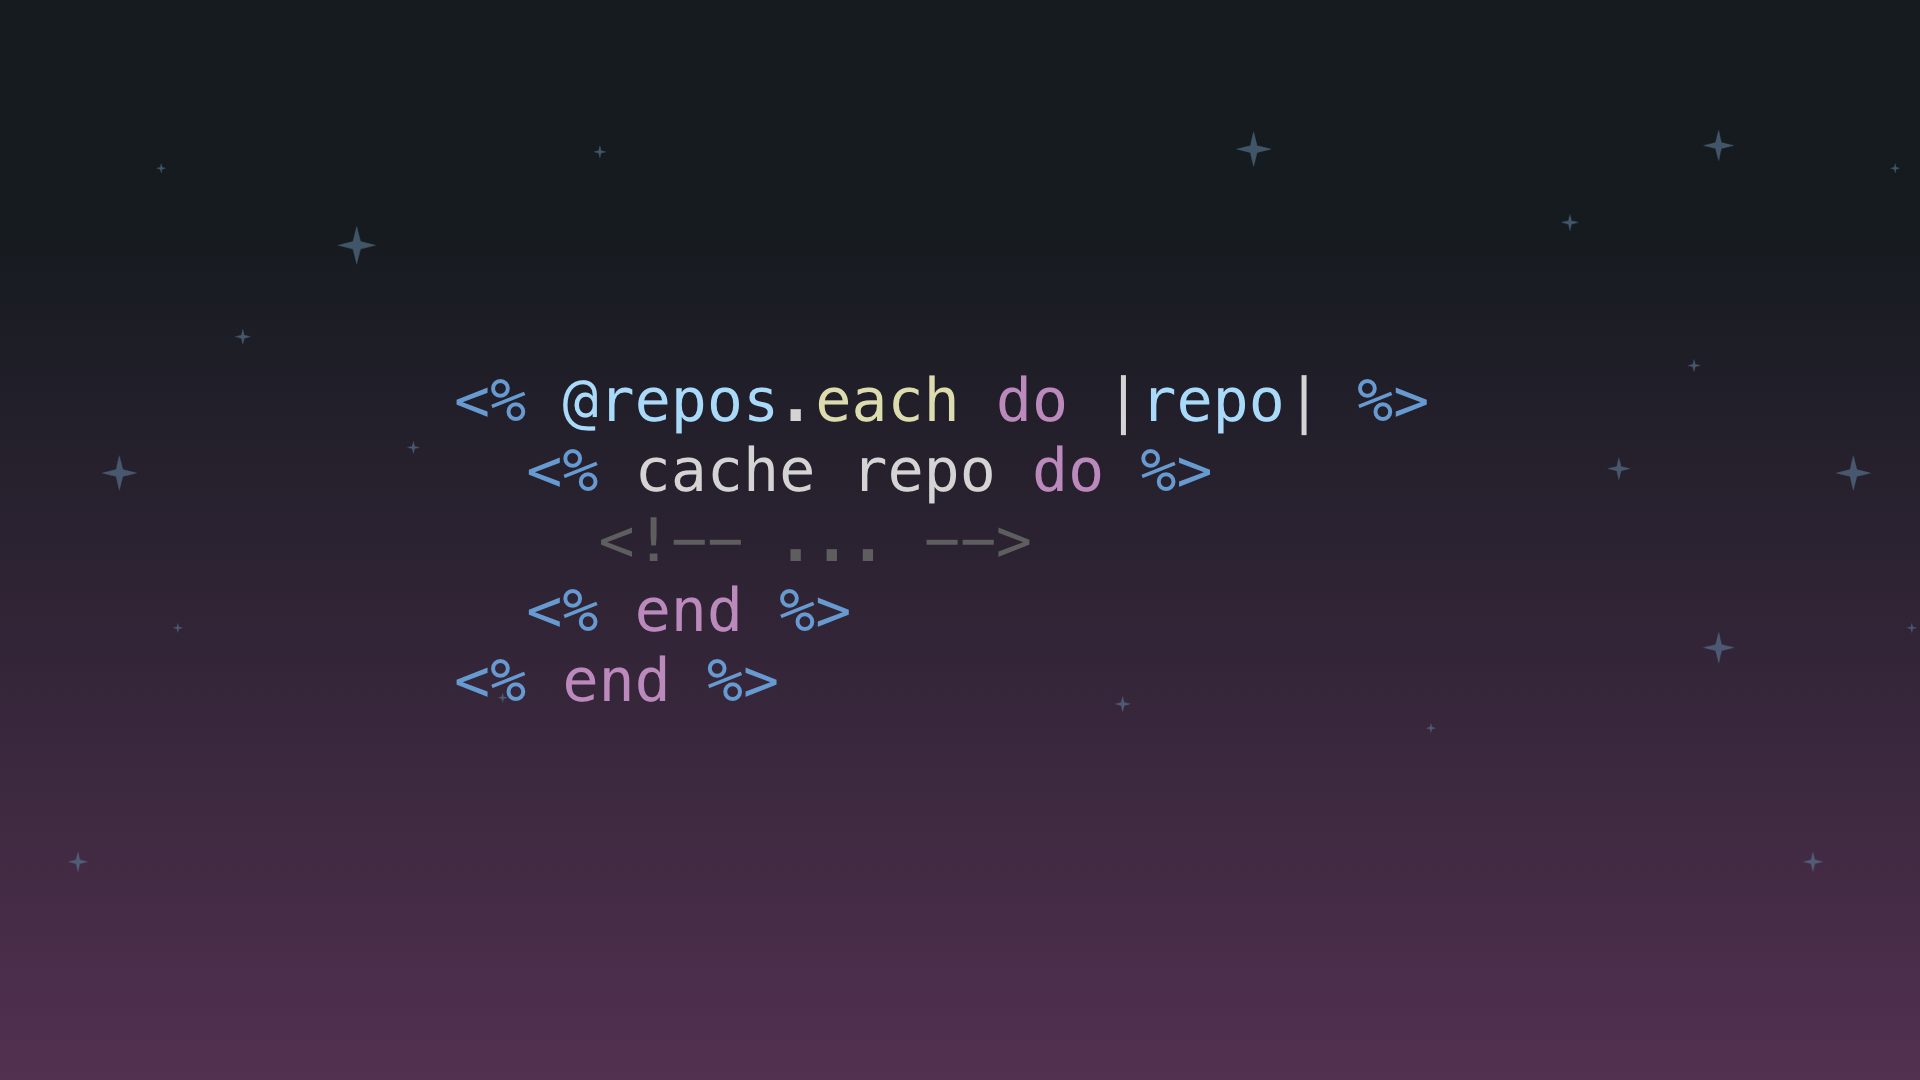
However, each cache call inside the loop need to read from Memcached separately. This would result in making one network request for every card that is rendered, which adds a lot of overhead.
This is sort of like the N+1 query problem, but for caching! Fortunately, Rails has provided the collection caching which the Code Triage maintainers are using to optimize this endpoint. This allowed Rails to read all the required cache fragment from Memcached in a single request, which eliminates significant overhead.
However, as we looked more closely at the logs, we realized that something was wrong:
Rendered collection of repos/_repo.html.slim [23 / 50 cache hits] (135.1ms)
For each request to the homepage, we were missing more than half of the 50 cards in the cache. If this were a one-time occurrence, it wouldn’t be a big deal; Rails would simply generate the missing content and write them to the cache. Then, any subsequent requests would be able to take advantage of that cached content. Strangely, however, we were able to consistently reproduce the cache misses, even when processing multiple consecutive requests to the home page.
At first, we thought that perhaps the cache was just way too small. But upon further investigation, we realized that the math didn't quite add up. We had provisioned a 100MB memcached store for this app. Sure, it would be nice to have a bigger cache, but each of these cards was around a few hundred bytes so, even at this size, it would still take at least a few hundred thousand of these cards to fill up the entire cache.
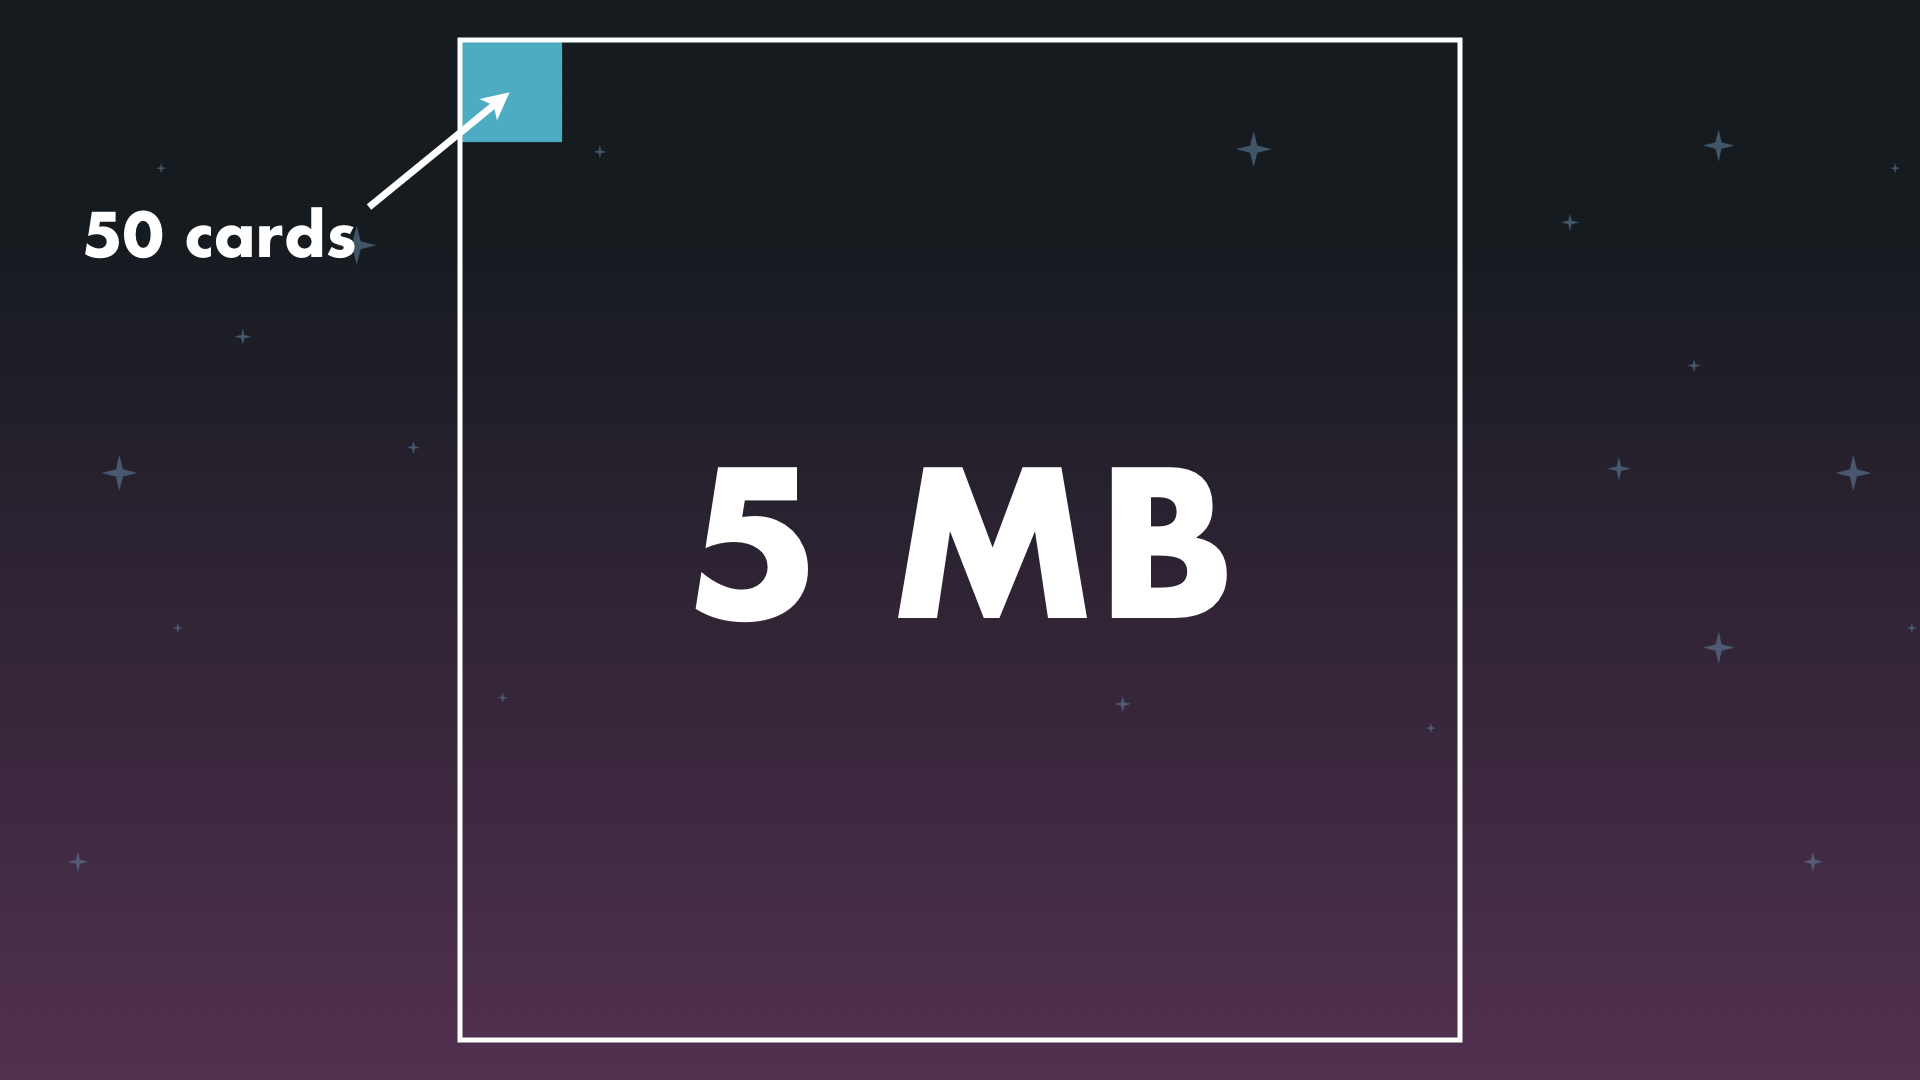
If this square is the 100MB cache store, the 50 cards that we were trying to cache would still only occupy a fraction of one pixel within a square of this size:

Filling up our memcached store definitely wasn't the issue. So maybe something very big in the cache was taking up all the space?
Revisiting Our Mental Model
Our mental model was centered around the fact that Memcached is a LRU, or a “least recently used” store. This meant that any new cache data would push out old data in a "first in, first out" manner. Since we were not caching anything big on the home page itself, our mental model suggested that Memcached would evict older items in the cache as needed in order to make room for our cards.
However, this does not match what we observed in the real world, so we began to realize that our mental model for how Memcached worked must be wrong! To solve this mystery, we needed to get a better understanding of how Memcached managed its data.
It's worth noting that we were not actually using Memcached directly in the context of Code Triage. We were actually using a SaaS provider, which implemented a proprietary, Memached-compatible store. Therefore, some of the following details are specific to their implementation, and does not apply to the open-source version of Memcached.
During our investigation, we learned that a 100MB Memcached store was not just 100MB of free space. When storing things in memory, there are always some overhead involved due to alignment and bookkeeping cost, and Memcached is no different. In order to manage memory efficiently, it grouped the data we were trying to store into different tiers based on their size, and managed space for each tier separately.
We were able to see this in action by running the STATS ITEMS command:
STAT items:0:chunk_size 64
STAT items:0:evicted 0
STAT items:0:evicted_nonzero 0
STAT items:0:number 0
STAT items:0:outofmemory 0
STAT items:1:chunk_size 128
STAT items:1:evicted 94
STAT items:1:evicted_nonzero 4
STAT items:1:number 18
STAT items:1:outofmemory 5
STAT items:2:chunk_size 256
STAT items:2:evicted 106659
STAT items:2:evicted_nonzero 0
STAT items:2:number 9040
STAT items:2:outofmemory 0
STAT items:3:chunk_size 512
STAT items:3:evicted 5356
STAT items:3:evicted_nonzero 981
STAT items:3:number 2
STAT items:3:outofmemory 57855
STAT items:4:chunk_size 1024
STAT items:4:evicted 1880488
STAT items:4:evicted_nonzero 0
STAT items:4:number 4982
STAT items:4:outofmemory 85445
STAT items:5:chunk_size 2048
STAT items:5:evicted 67687
STAT items:5:evicted_nonzero 0
STAT items:5:number 5605
STAT items:5:outofmemory 0
STAT items:6:chunk_size 4096
STAT items:6:evicted 135319
STAT items:6:evicted_nonzero 0
STAT items:6:number 11126
STAT items:6:outofmemory 0
...
Looking at the output above, we can see the sizes for the different tiers, the number of items currently stored in that tier, as well as how many items have been evicted. Since all the card fragments were generally around the same size, they would end up being cached in the same bucket—specifically, bucket number 4.
Since each item in bucket number 4 was taking up 1KB of space, and it was allocated space to hold around 5000 items, that worked out to a total of 5MB of storage. The implication here is that, when talking about similarly sized items, they might be competing for a much smaller amount of space than you thought.
Still, while 5MB was a lot smaller than we originally thought, that's still plenty of space. If we look at our homepage, we are only trying to cache 50 cards, but we should have enough space to hold 5000. Once again, the math still doesn’t add up, so this wasn't the end of our story.
However, when we looked more closely at the STATS command, we saw that the eviction count was indeed very high on this bucket: we had evicted almost 2 million items from this bucket alone!
This supported our observation that our cache was overflowing, and spilling things out as fast as we were putting things in.
At this point in our investigation, the only explanation we could come up with was that there must have been something other than our cards in this bucket that was taking up all the space, which was somehow not getting evicted. Ideally, we would have just opened up this bucket and seen what was taking up all the space. Unfortunately, the SaaS provider did not offer that ability.
Based on our research, we made an educated guess. Memcached has a feature that automatically expires cache entries, also known as "TTL", or "Time-To-Live". Our theory was that, when mixing TTL data and non-TTL data in the same bucket, this cache store would always choose to evict non-TTL data first before any TTL data was even considered for eviction.
Since our cards did not have a TTL, and because our cache was pretty full, they must have always been the first ones to be evicted. So, we decided to manually flush the entire cache. Sure enough, it freed up space for our cards, which allowed us to achieve a 100% cache hit rate on the homepage, and resulted in a pretty dramatic performance improvement.
Digging Deeper
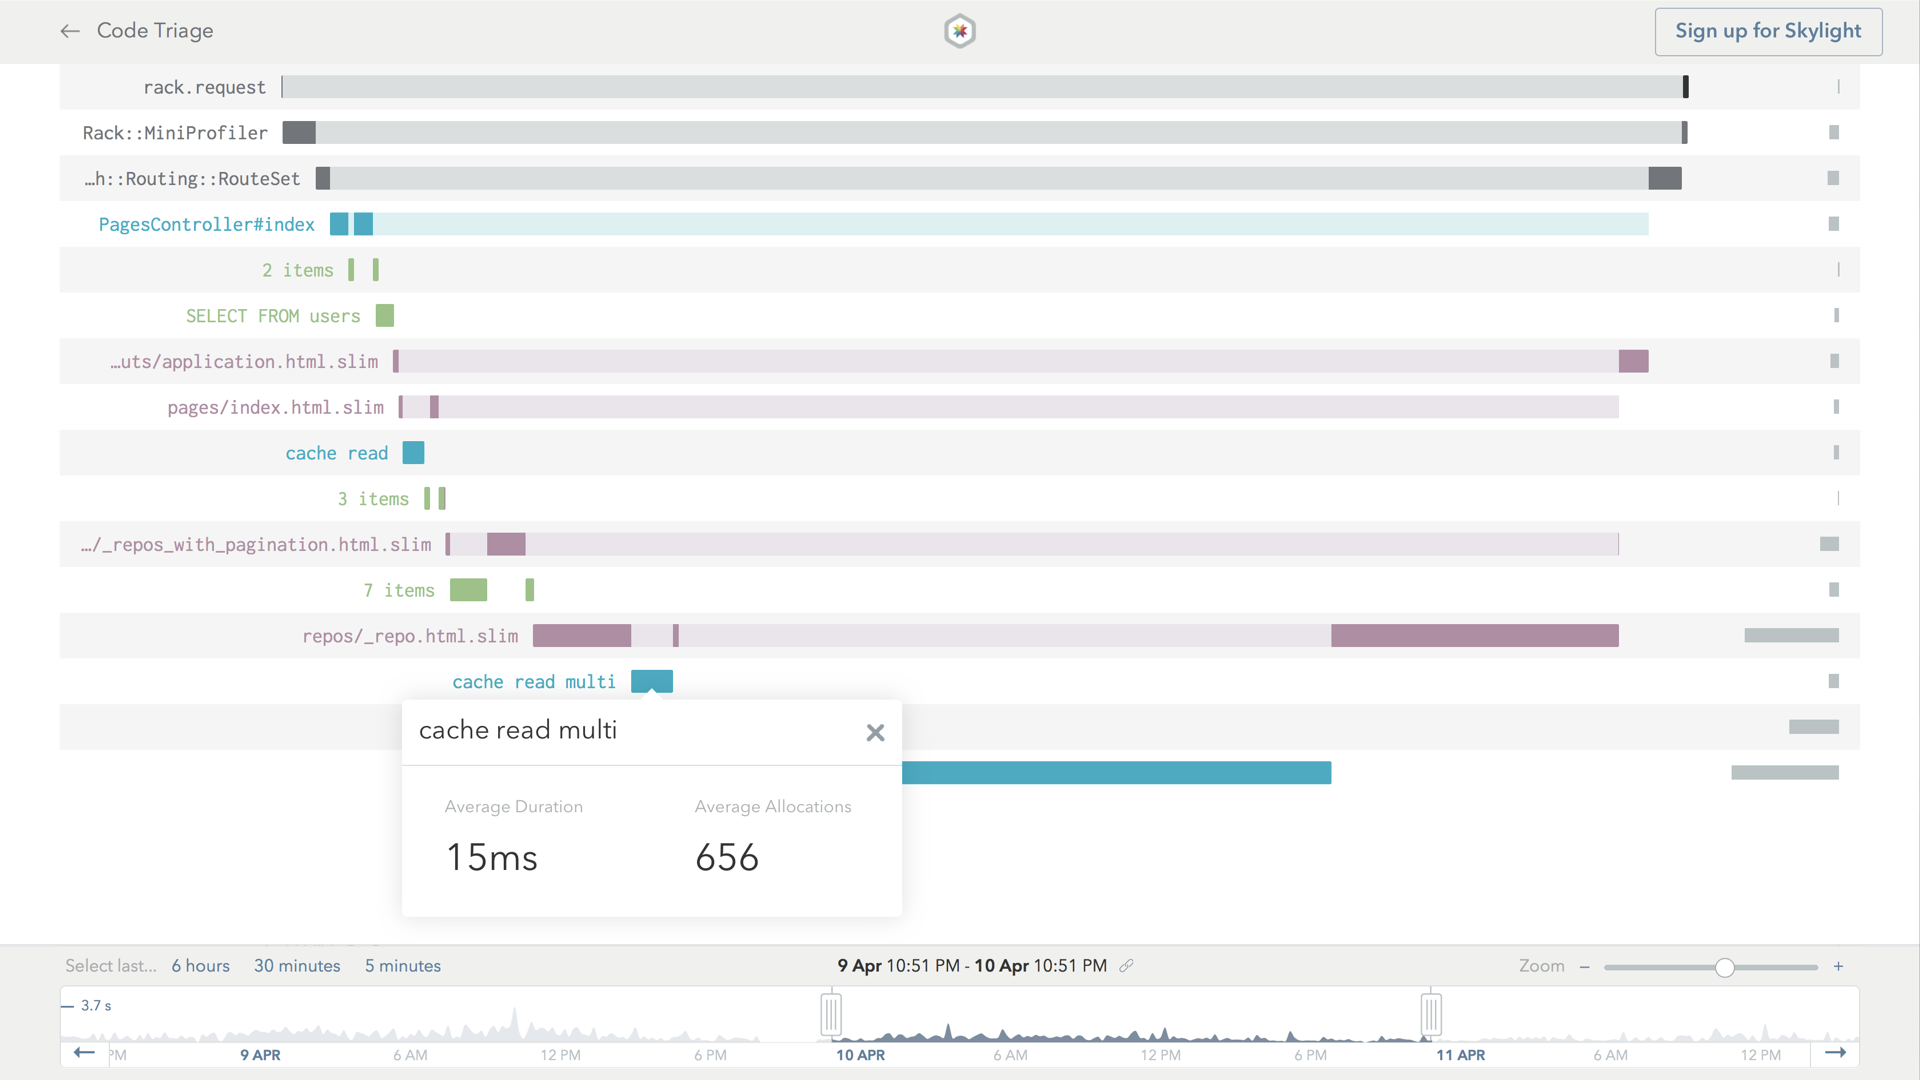
While the cache flush solved our cache overflow problem, during our investigation we also noticed something else that was strange and noteworthy. Here is the Skylight trace for the endpoint, before we flushed the cache:
Even though Rails was using reading in all the cache fragments with a single READ MULTI request, it was still spending a lot of time reading from and writing to the cache after the initial READ MULTI request. In fact, the subsequent cache reads added up to more than double the time of the initial request! The logs showed this happening, too:
Cache read: views/repos/3353-20180413142449772302/b201d971de1a77b9f19a62934e479a96
Cache write: views/repos/3353-20180413142449772302/b201d971de1a77b9f19a62934e479a96
Cache read: views/repos/1055-20180413141006040871/b201d971de1a77b9f19a62934e479a96
Cache write: views/repos/1055-20180413141006040871/b201d971de1a77b9f19a62934e479a96
Cache read: views/repos/1332-20180413141232839666/b201d971de1a77b9f19a62934e479a96
Cache write: views/repos/1332-20180413141232839666/b201d971de1a77b9f19a62934e479a96
Cache read: views/repos/2151-20180413141907871737/b201d971de1a77b9f19a62934e479a96
Cache write: views/repos/2151-20180413141907871737/b201d971de1a77b9f19a62934e479a96
Cache read: views/repos/1082-20180413140958427040/b201d971de1a77b9f19a62934e479a96
Cache write: views/repos/1082-20180413140958427040/b201d971de1a77b9f19a62934e479a96
Cache read: views/repos/1524-20180413141412726203/b201d971de1a77b9f19a62934e479a96
Cache write: views/repos/1524-20180413141412726203/b201d971de1a77b9f19a62934e479a96
Cache read: views/repos/1916-20180413141546875915/b201d971de1a77b9f19a62934e479a96
Cache write: views/repos/1916-20180413141546875915/b201d971de1a77b9f19a62934e479a96
Cache read: views/repos/1348-20180413141215739127/b201d971de1a77b9f19a62934e479a96
Cache write: views/repos/1348-20180413141215739127/b201d971de1a77b9f19a62934e479a96
Cache read: views/repos/177-20180413140322053324/b201d971de1a77b9f19a62934e479a96
Cache write: views/repos/177-20180413140322053324/b201d971de1a77b9f19a62934e479a96
Cache read: views/repos/1824-20180413141520630598/b201d971de1a77b9f19a62934e479a96
Cache write: views/repos/1824-20180413141520630598/b201d971de1a77b9f19a62934e479a96
Cache read: views/repos/1901-20180413141634501842/b201d971de1a77b9f19a62934e479a96
Cache write: views/repos/1901-20180413141634501842/b201d971de1a77b9f19a62934e479a96
Cache read: views/repos/863-20180413140900779427/b201d971de1a77b9f19a62934e479a96
Cache write: views/repos/863-20180413140900779427/b201d971de1a77b9f19a62934e479a96
Cache read: views/repos/386-20180413140542430556/b201d971de1a77b9f19a62934e479a96
Cache write: views/repos/386-20180413140542430556/b201d971de1a77b9f19a62934e479a96
Cache read: views/repos/1996-20180413141654477686/b201d971de1a77b9f19a62934e479a96
Cache write: views/repos/1996-20180413141654477686/b201d971de1a77b9f19a62934e479a96
Cache read: views/repos/528-20180413140609506027/b201d971de1a77b9f19a62934e479a96
Cache write: views/repos/528-20180413140609506027/b201d971de1a77b9f19a62934e479a96
Cache read: views/repos/3072-20180413142336550445/b201d971de1a77b9f19a62934e479a96
Cache write: views/repos/3072-20180413142336550445/b201d971de1a77b9f19a62934e479a96
Cache read: views/repos/1421-20180413141154176342/b201d971de1a77b9f19a62934e479a96
Cache write: views/repos/1421-20180413141154176342/b201d971de1a77b9f19a62934e479a96
Cache read: views/repos/2216-20180413141847819637/b201d971de1a77b9f19a62934e479a96
Cache write: views/repos/2216-20180413141847819637/b201d971de1a77b9f19a62934e479a96
Cache read: views/repos/3916-20180413142706315602/b201d971de1a77b9f19a62934e479a96
Cache write: views/repos/3916-20180413142706315602/b201d971de1a77b9f19a62934e479a96
Cache read: views/repos/3793-20180413142632521852/b201d971de1a77b9f19a62934e479a96
Cache write: views/repos/3793-20180413142632521852/b201d971de1a77b9f19a62934e479a96
Cache read: views/repos/696-20180413140702557180/b201d971de1a77b9f19a62934e479a96
Cache write: views/repos/696-20180413140702557180/b201d971de1a77b9f19a62934e479a96
Cache read: views/repos/1521-20180413141315869506/b201d971de1a77b9f19a62934e479a96
Cache write: views/repos/1521-20180413141315869506/b201d971de1a77b9f19a62934e479a96
Cache read: views/repos/781-20180413140752378480/b201d971de1a77b9f19a62934e479a96
Cache write: views/repos/781-20180413140752378480/b201d971de1a77b9f19a62934e479a96
Cache read: views/repos/297-20180413140459380343/b201d971de1a77b9f19a62934e479a96
Cache write: views/repos/297-20180413140459380343/b201d971de1a77b9f19a62934e479a96
Cache read: views/repos/764-20180413140728504164/b201d971de1a77b9f19a62934e479a96
Cache write: views/repos/764-20180413140728504164/b201d971de1a77b9f19a62934e479a96
Cache read: views/repos/2188-20180413141834504728/b201d971de1a77b9f19a62934e479a96
Cache write: views/repos/2188-20180413141834504728/b201d971de1a77b9f19a62934e479a96
Cache read: views/repos/1224-20180413141032106598/b201d971de1a77b9f19a62934e479a96
Cache write: views/repos/1224-20180413141032106598/b201d971de1a77b9f19a62934e479a96
Cache write: views/repos/3353-20180413142449772302/b201d971de1a77b9f19a62934e479a96
Cache write: views/repos/1055-20180413141006040871/b201d971de1a77b9f19a62934e479a96
Cache write: views/repos/1332-20180413141232839666/b201d971de1a77b9f19a62934e479a96
Cache write: views/repos/2151-20180413141907871737/b201d971de1a77b9f19a62934e479a96
Cache write: views/repos/1082-20180413140958427040/b201d971de1a77b9f19a62934e479a96
Cache write: views/repos/1524-20180413141412726203/b201d971de1a77b9f19a62934e479a96
Cache write: views/repos/1916-20180413141546875915/b201d971de1a77b9f19a62934e479a96
Cache write: views/repos/1348-20180413141215739127/b201d971de1a77b9f19a62934e479a96
Cache write: views/repos/177-20180413140322053324/b201d971de1a77b9f19a62934e479a96
Cache write: views/repos/1824-20180413141520630598/b201d971de1a77b9f19a62934e479a96
Cache write: views/repos/1901-20180413141634501842/b201d971de1a77b9f19a62934e479a96
Cache write: views/repos/863-20180413140900779427/b201d971de1a77b9f19a62934e479a96
Cache write: views/repos/386-20180413140542430556/b201d971de1a77b9f19a62934e479a96
Cache write: views/repos/1996-20180413141654477686/b201d971de1a77b9f19a62934e479a96
Cache write: views/repos/528-20180413140609506027/b201d971de1a77b9f19a62934e479a96
Cache write: views/repos/3072-20180413142336550445/b201d971de1a77b9f19a62934e479a96
Cache write: views/repos/1421-20180413141154176342/b201d971de1a77b9f19a62934e479a96
Cache write: views/repos/2216-20180413141847819637/b201d971de1a77b9f19a62934e479a96
Cache write: views/repos/3916-20180413142706315602/b201d971de1a77b9f19a62934e479a96
Cache write: views/repos/3793-20180413142632521852/b201d971de1a77b9f19a62934e479a96
Cache write: views/repos/696-20180413140702557180/b201d971de1a77b9f19a62934e479a96
Cache write: views/repos/1521-20180413141315869506/b201d971de1a77b9f19a62934e479a96
Cache write: views/repos/781-20180413140752378480/b201d971de1a77b9f19a62934e479a96
Cache write: views/repos/297-20180413140459380343/b201d971de1a77b9f19a62934e479a96
Cache write: views/repos/764-20180413140728504164/b201d971de1a77b9f19a62934e479a96
Cache write: views/repos/2188-20180413141834504728/b201d971de1a77b9f19a62934e479a96
Cache write: views/repos/1224-20180413141032106598/b201d971de1a77b9f19a62934e479a96
Rendered collection of repos/_repo.html.slim [23 / 50 cache hits] (135.1ms)
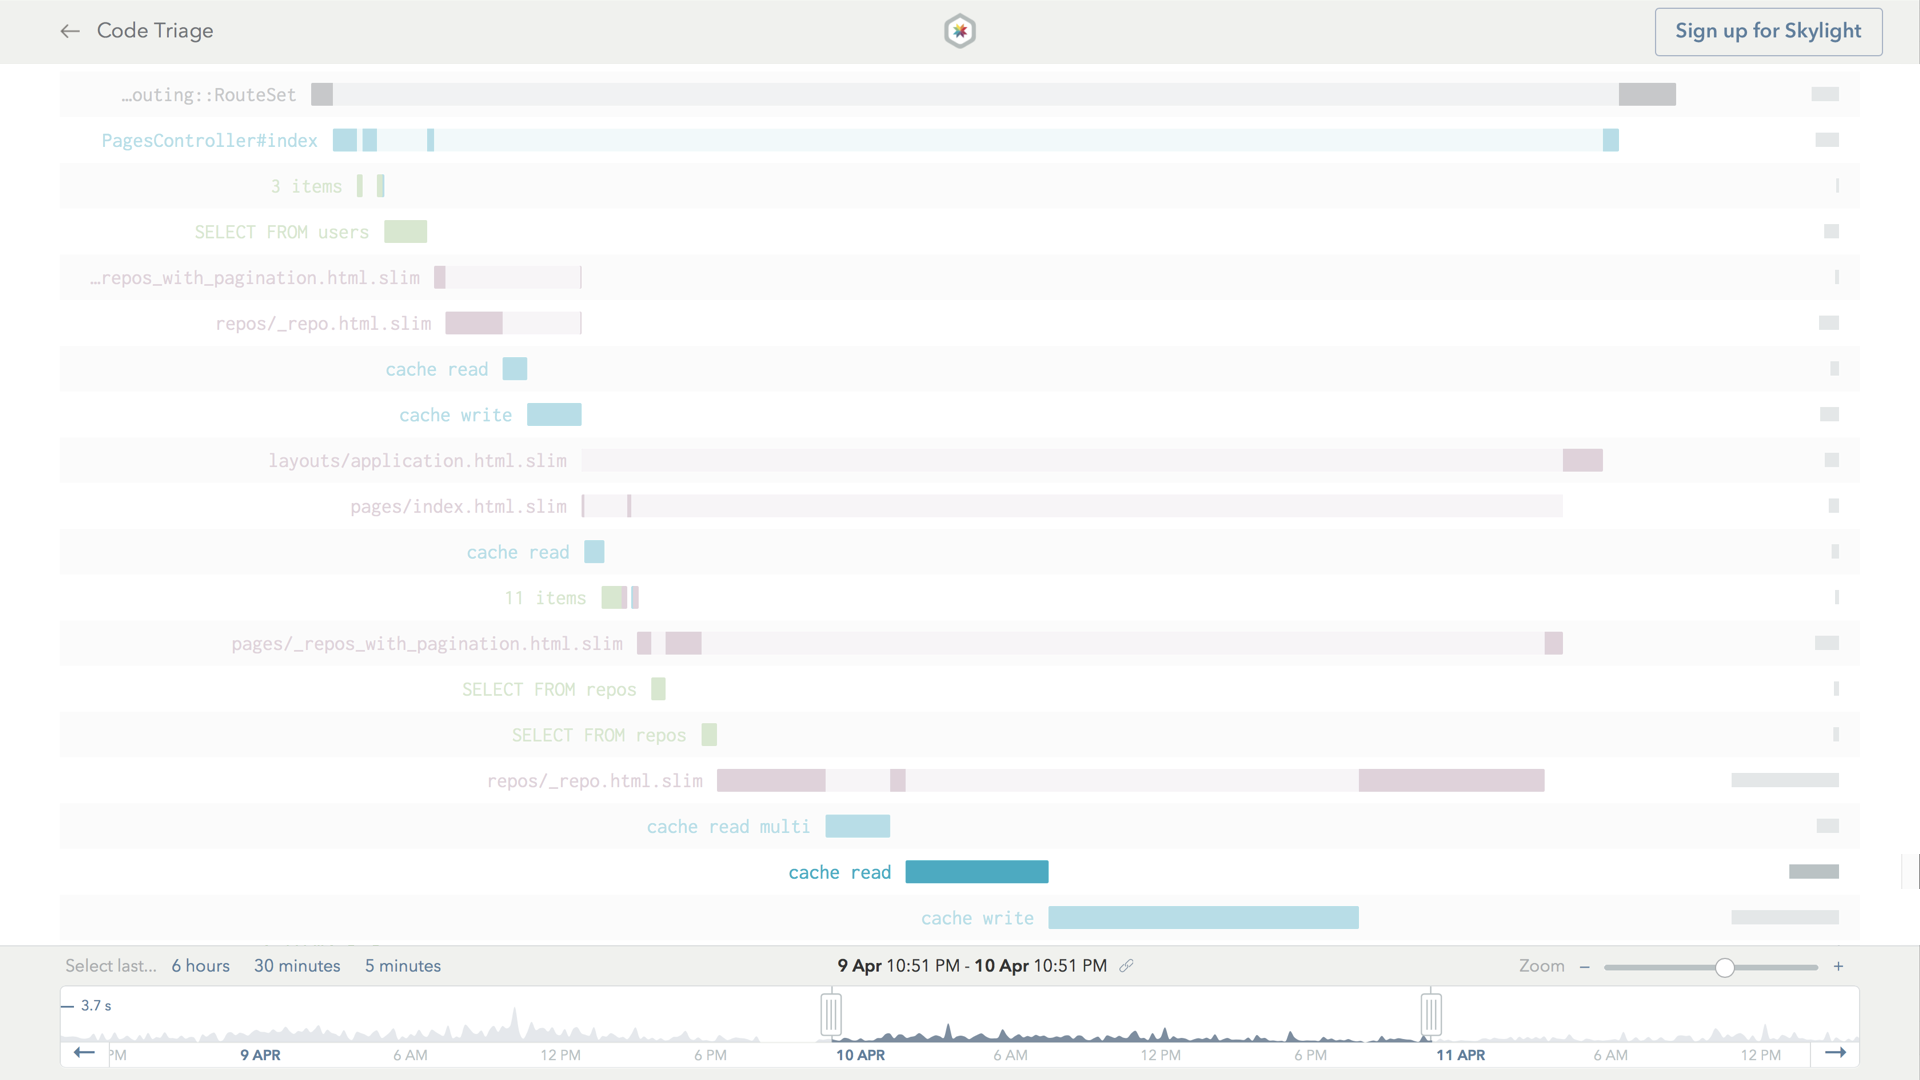
But when rendering the missing cards, we were doing another cache READ, even though we already knew that they were not in the cache, since the store didn’t return anything for these values in the READ MULTI request. These cache READs were completely unnecessary, and we wanted to be able to eliminate this bar entirely, even when we had cache misses.
Furthermore, when reading the logs, we saw that each missing fragment was being written to the cache twice, in the same request!
Eventually, we tracked this issue down to a double-wrapping of cache blocks, and we opened a pull request to address this issue to great success.
Since merging this patch in my average response time on https://t.co/XFkbhETLAP has gone down by 26%. Pretty impressive. Thanks again @skylight https://t.co/uKzTAldDOH
— Richard Schneeman 🤠 @ VacationConf (@schneems) April 25, 2018
Contributing Full Circle
While submitting our fix to Code Triage, we discovered that a bug in Rails 5.2 that was causing each cache item to take up twice the space than was necessary. We submitted another pull request, this time to Rails itself. We fixed a bug where ActiveSupport::Cache massively inflated the storage size when compression is enabled (which is the default configuration).
We expect this fix to be released in Rails 5.2.1 very soon. We also believe the double cache read/writes behavior is also arguably a bug in Rails itself, and we plan to upstream a patch to prevent this from happening to other apps.
We started by looking for ways help our favorite open source apps using Skylight, and we were pretty successful in accomplishing that. But we also ended up doing something even more impactful: we ended up finding ways to contribute back to upstream projects, like Rails!
We hope that the Skylight for Open Source Program and our learnings from our OSS-athon will inspire more contributors to do the same.
Interested in joining the Skylight for Open Source Program? Learn more and see other open source apps in action! Want to use Skylight for your work apps, too? Sign up for your 30-day free trial! Or refer a friend and you both get $50 in credit.