Announcing Memory Traces
We've just released a new feature in Skylight that makes it easy to see where your Rails app is allocating memory. With new memory traces, you can reduce bloat and improve the response time of your app.
Many performance monitoring tools treat requests as though they exist in isolation. Sometimes, though, the things you do in one request can slow down other requests.
Allocating many objects can cause expensive garbage collection sweeps to become more frequent, slowing down the performance of your entire app. Worse, these GC pauses happen seemingly at random, and disconnected from the requests that caused all of the allocations in the first place.
With new memory traces, you can now visualize allocations in an endpoint across thousands or millions of requests.

Best of all, we are able to provide this profiler-level detail with imperceptible overhead, thanks to our new Featherweight agent. We can quickly sample the Ruby stack across all of your requests, each sample taking a fraction of a second. When aggregated together, you can get a detailed look at what part of your app is hogging memory.
To start using memory traces, update the skylight gem to 0.5.1 in your Gemfile and redeploy your app.
Note that allocation information will only be collected using the new agent and requires Ruby 2.1 or later. If you try to view a time period from before upgrading, you'll receive a message letting you know that data isn't available.
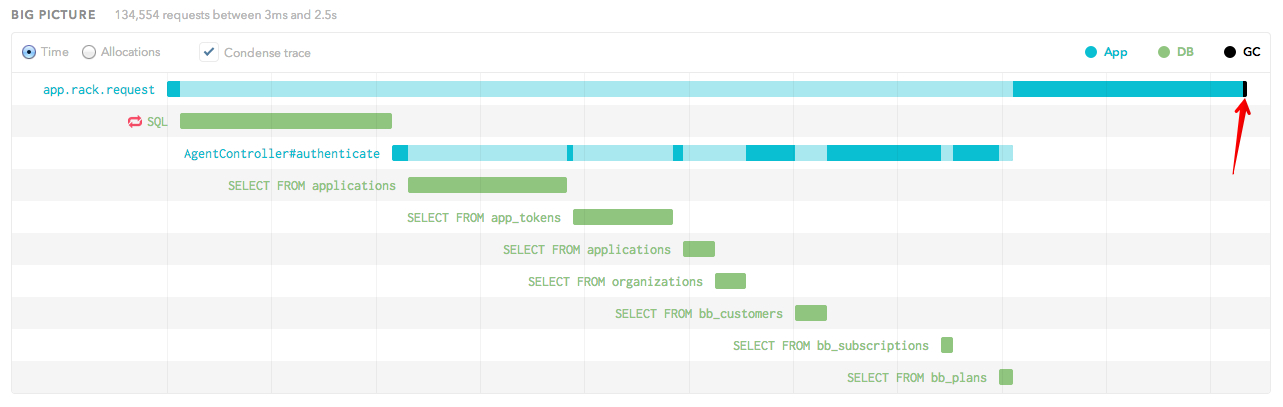
So how do you use this feature to make your app faster? First, don't worry about allocations unless either GC time is high, or any given event takes a while. (Remember that Skylight reports GC time at the end of each trace, as illustrated below.)
If GC time is high, then there are a lot of objects being allocated, causing GC pressure. In that case, you want to find the areas of your app that have high allocations and investigate further.
Events with both high duration and a large number of allocations can indicate inefficient Ruby code. It would be a good idea to add some extra instrumentation to track down what is going on.
Could your Rails app be performing better? Sign up for an unlimited, free 30-day trial of Skylight, now with memory traces.